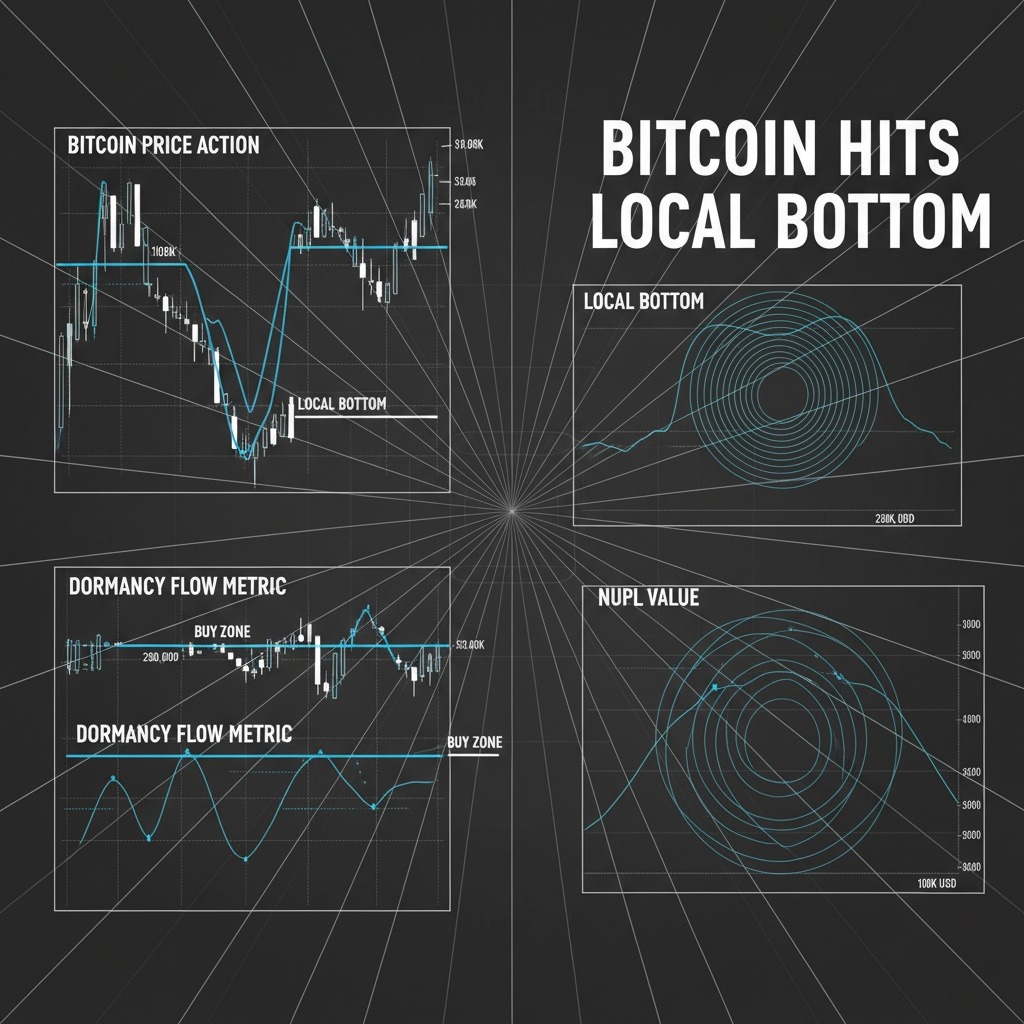
Recent market data points to Bitcoin’s (BTC) price of $108,650 as a potential local bottom, as three key indicators signal a possible recovery movement. Following its recent lows, Bitcoin has seen a 5% uptick, climbing up to approximately $114,000, igniting discussions about a bullish turnaround.
One of the primary metrics indicating this potential bottom is the entity-adjusted dormancy flow of Bitcoin, which measures the relationship between BTC’s current market capitalization and its annualized dormancy value in US dollars. Historical data shows that when this figure dips below 250,000, it often signifies a prime buying opportunity. Currently, this metric has fallen to 133,300, reinforcing the idea that we may have reached a pivotal market juncture.
Analysts have noted that similar breakouts from this level have often coincided with the start of notable bull runs. An instance of this can be traced back to July 2021, when Bitcoin experienced a similar drop, only to rebound significantly, eventually reaching a then all-time high of $69,000 by November.
Another noteworthy factor is the short-term holder Net Unrealized Profit/Loss (NUPL), which has recently shifted into negative territory. This change suggests seller fatigue among investors who have held Bitcoin for less than 155 days. According to on-chain data provider Glassnode, such “capitulation events” are historically associated with market resets, often laying the groundwork for new accumulation periods.
A prominent crypto influencer echoed this sentiment, noting that episodes characterized by negative NUPL readings typically coincide with price bottoms. Following such a period, excess selling pressure commonly subsides, allowing new demand from long-term holders to stabilize and potentially elevate prices.
Historical examples include the market’s behavior in April when Bitcoin’s price hovered below $75,000 before surging by 65% to hit $124,500. The negative NUPL readings observed then similarly signaled exhaustion among sellers, a pattern which traders are currently observing.
Additionally, technical analysis reveals a V-shaped reversal pattern on Bitcoin’s 12-hour chart. Following a sharp decline of 7.8% to $108,700, buyers stepped in to create upward momentum, pushing the price higher. This resurgence has boosted the relative strength index (RSI) from a low of 27 in the oversold territory to a more comfortable 53, indicating an increase in buying activity.
If the current price action successfully completes the V-shaped formation, Bitcoin could test resistance around the $118,000 mark, translating to a 4% increase from its current valuation. Furthermore, a broader analysis of the daily chart suggests the emergence of a double-bottom pattern, which might project the price toward all-time highs of $124,500, should the $118,000 resistance be surmounted.
In summary, Bitcoin holders and market watchers are keenly observing these indicators as they may suggest that the recent low price of $108,650 could signify a critical turning point for the cryptocurrency. With the potential for continued upside as sellers are exhausted, all eyes are now on how the market will respond in the coming days.