This week in the cryptocurrency markets, Bitcoin’s (BTC) momentum faces a significant challenge amid the dollar’s recent behavior, while XRP grapples with renewed bearish signals. CoinDesk’s market analyst Omkar Godbole provides insights into the evolving landscape as anticipated remarks from the Federal Reserve (Fed) and key inflation data loom on the horizon.
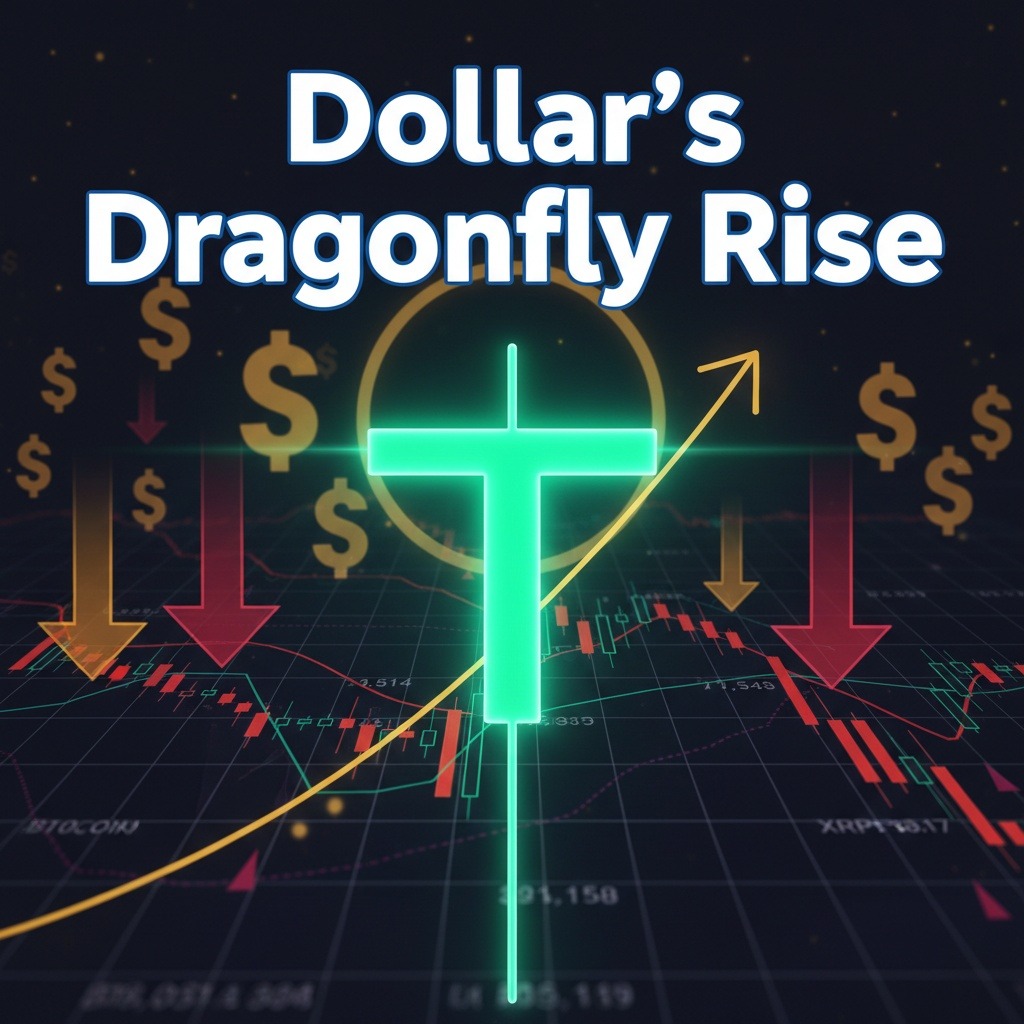
In a landmark move last week, the Fed executed its first interest rate cut since December, highlighting an inclination towards easing monetary policy in the near future. Despite this shift, the U.S. dollar index (DXY) ended the week with a distinct “dragonfly doji” pattern on its weekly chart. This formation is typically viewed as a bullish reversal signal, suggesting potential upward movement for the US dollar, despite the recent dovish stance from the Fed.
The dragonfly doji pattern is recognized by its unique “T” shape, which symbolizes a balance between buying and selling pressures. In the case of the DXY, this pattern emerged after a decline, indicating that buyers swiftly intervened to reverse what initially seemed like downward momentum. After briefly dropping below key support levels, the dollar bounced back and closed relatively stable at 97.65, buoyed by the resilience of U.S. Treasury yields. Traditionally, a strong dollar parallels weakness in dollar-denominated assets, setting the stage for BTC’s performance in the week ahead.
Bitcoin mirrored the uncertainty in market sentiment last week, forming a doji candle at a critical resistance level defined by the trendlines from the peaks of bull markets in 2017 and 2021. This indecisive candle implies a lack of bullish strength, suggesting a struggle among buyers to push prices past this resistance. The daily chart indicates BTC is flirting with a potential drop below the Ichimoku cloud, exacerbated by a break of the trendline drawn from the lows of September 1.
The immediate support level for Bitcoin stands at $114,473, coinciding with the 50-day simple moving average, while key lows around $107,300 also loom. The previous week’s high of $118,000 serves as a crucial barrier that Bitcoin must overcome to mitigate bearish prospects.
On the other hand, Ether (ETH) appears trapped in its own bearish formation. Currently hovering below the lower edge of a contracting triangle pattern, ETH signals a dominance of sellers in the market, with deeper losses possible. Looking ahead, traders are eyeing the recent low near $4,062, followed by the critical psychological support level of $4,000. A bullish turnaround requires overcoming the recent peak of $4,458.
Shifting focus to XRP, the recent launch of an exchange-traded fund (ETF) has not translated into sustained bullish momentum. The weekly MACD indicator has crossed into bearish territory, indicating a renewed downward pressure on prices. Although XRP recently attempted a breakout from a descending triangle pattern, the failure to maintain upward movement has left investors cautious as the price slips back toward the triangle’s upper boundary.
All eyes are set on upcoming speeches from Fed Chairman Jerome Powell, along with nine other Federal Reserve officials. Market participants will seek insights into future interest rate adjustments in light of last week’s rate cut and Powell’s emphasis on a cautious approach reliant on forthcoming economic data.
Additionally, the U.S. core PCE index—an essential measure of inflation preferred by the Fed—is due for release on Friday. Projections suggest a year-on-year inflation increase of 2.7%, while core inflation may rise by 2.9%, creating a critical backdrop against which the Fed’s monetary policy will be assessed.
As the week unfolds, the interplay between the dollar’s performance, Bitcoin’s resistance levels, and XRP’s bearish indicators will undoubtedly shape market sentiment and trading strategies in the digital asset realm.


